NYC Runs Subway Challenge 2020 - Pulling data from the Strava API
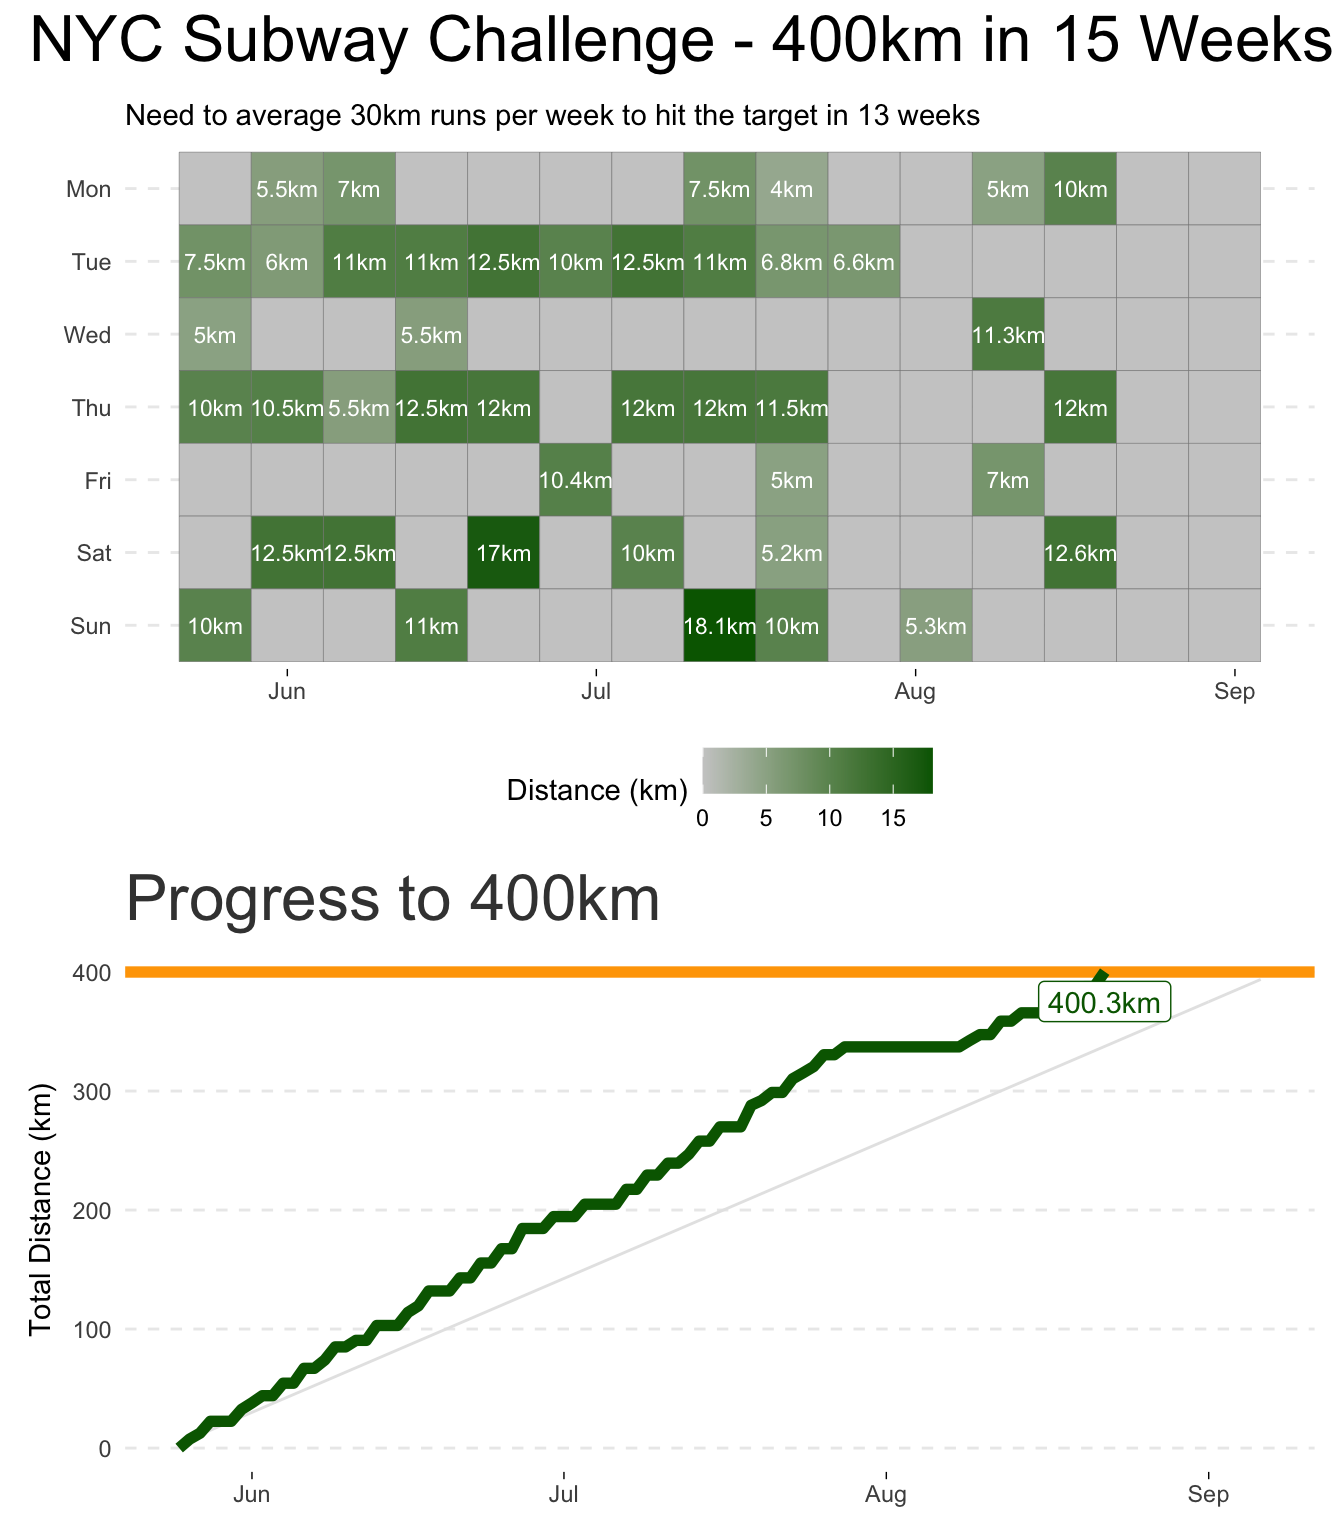
My 2020 lockdown fitness challenge was the NYC Runs Subway Challenge which involves running a total of 245 miles / 400 kilometres in the 15 weeks between Memorial Day (25th May 2020) and Labour Day (7th September 2020).
I averaged 30km per week and got things done 2 weeks early, despite a 🙄 glute injury at week 10 which kept me out of action for 10 days.
To keep me motivated and on track I pulled my running data down regularly from the Strava API and monitored my progress along the way using the charts below. I found these two simple charts enough to keep me on track.
ggplot code for these charts is here
Pulling activity data from the Strava API using R
The Strava API is straight forward to query once you get over the authentication hurdles. I use R to query the API to generate the the above charts.
OAuth Authentication
To query the API you need an OAuth token. The Strava OAuth documentation is comprehensive but in summary the steps are
Create a new app and generate a client_id and secret for api access (https://developers.strava.com/docs/getting-started/#account)
Using the httr library, generate the oauth token
library(httr)
app <- oauth_app("strava", <CLIENT_ID>, <SECRET>)
endpoint <- oauth_endpoint(
  request = NULL,
  authorize = "https://www.strava.com/oauth/authorize",
  access = "https://www.strava.com/oauth/token"
)

token <- oauth2.0_token(endpoint, app, as_header = FALSE, scope = "activity:read_all")
Query the Strava athlete/activities endpoint
The Strava API is paginated so you need to write code to aggregate data from multiple returned pages.
First a small function to call the API and return a data.frame of results
# Function to call the strava v3/athlete/activities API
# This API is paginated, so you need to pass a page_number and page_size to retrieve > 1
# page of results (default 200 results per page)
strava_athlete_activities_api <- function(oauth_token, page_number, page_size = STRAVA_API_DEFAULT_PAGE_SIZE) {
  print(paste0("Querying Strava V1 API v3/athlete/activities [page ", page_number, "]"))
  resp <- GET(
    url = "https://www.strava.com/api/v3/athlete/activities",
    config = oauth_token,
    query = list(per_page = page_size, page = page_number))

  if (http_type(resp) != "application/json") {
    stop("API did not return json", call. = FALSE)
    break
  }

  # Strava API returns data in JSON format, so parse it and return as a data.frame
  jsonlite::fromJSON(content(resp, "text"), flatten = FALSE)
}
Then a loop to keep calling the API until no more results are available
# A list to store the returned data into
data_pages <- list()

# Start with page #1
page_number <- 1

repeat {

# Query API
  data_pages[[page_number]] <- strava_athlete_activities_api(token, page_number)

  # Count number of records returned
  records_returrned <- data_pages[[page_number]] %>% nrow()
  print(paste0('Retrieved ', records_returrned, ' records'))

  # Continue to the next page if the number of returned records matches the page size
  if (records_returrned < STRAVA_API_DEFAULT_PAGE_SIZE) {
    print("All records returned, exiting")
    break
  } else {
    print("checking for more records ..")
    page_number <- page_number + 1
  }
}

# Combine the list of data frames into a single dataframe of all collected pages
data <- rbind_pages(data_pages)
print(paste0('returned a total of ', data %>% nrow(), ' records'))
You will now have the full history of your Strava activities! Hopefully you can use this to chart and analyse your own strava activity!
Full script code is here
Let me know (via the messenger or LinkedIn/Twitter) if you have any thoughts, improvements or questions, PR’s welcome.